[TRADE TRACKING]

Developed it a bit over the weekend, here's some raw data from a certain somebody I know. It will probably take about 50 entries until the reports etc start to show some good information.

The stuff in blue is what I did today:

The ratio is the risk:reward calculation. The system also predicts what it thinks the outcome will be, this is based on:
  1. Max gain - Max Loss x R:R^2
  2. Average profits per trade
The heat index is just to rate the trade:
  1. 2 = Abysmal (bad risk reward, bad monetary reward)
  2. 3 = Below par (one bad, one good)
  3. 4 = Ideal (both risk reward and monetary reward add up)
The monetary reward is based on the predicted trade return being greater or lower than the average win/loss per trade. At the moment, after 4 losing trades, this data will always give a YES and a score for that column. After enough data is in there, it will be better to track each trade.

Couple of scalps in that selloff to add to the stats (heat index working now):

[TRADE TRACKING]

Spent most of the weekend programming a new spreadsheet for Excel. Always have to manually enter trades because my platform won't export the data. Anyway, pretty pleased with the outcome.

Couple of teething programs about the Excel code, I'm trying to code an IF AND THEN COUNT with minimal success. This part is for IF (setup) AND (profit) THEN (count). I would also like to try to eventually program in an odds calculator. For example if X and Y setups consistently reap profit on X, then increase reward ratios.

I am currently programming a risk:reward to profit ratio which should be interesting. Basically it involves a pre-trade calculator that will give you a number between 1 and 5. The numbers are based on historical data and represent high risk to low risk and high reward to low reward. If I can combine this data with average profits based on the particular setup, the calculator should then show if your odds are strongly favourable or are very weak.

I normally use risk reward as a simple ratio where target gains/target loss. The higher the number the better. This is good in itself, but I think combining it with other probabilities will give a good decision making calculation.

I also need to find a way to export trade data through VBA into Excel.

Anyway the entry screen (simple):

Outcome (with sample data):


Topical information:
  1. Calculates individual trade performance
  2. Calculates daily trade performance
  3. Calculates performance by setup
  4. Calculates profits by stock
  5. Calculates win loss ratios
  6. Calculates S/L bias and percentages
  7. Interprets whether you are currently beating hypothetical profits
  8. Calculates closed trades by Targets met, Targets exceeded or Failed to meet
  9. Interprets your ability to close out a trade with regards to entry targets
  10. Displays cumulative net profit
  11. Trade browser tree by Date/Profit/Share/Direction/Setup
  12. Trade cross-reference
Lots of these are based on simple formulas, eg to count a winning long
  • Long =1
  • Short = 7
  • Win = 1
  • Loss = 10
Therefore
  • 8 = Short win
  • 17 = Short loss
  • 2 = Long win
  • 11 = Long loss
Use the COUNTIF and SUM formulas.

I'm sure there are programs out there that do all of this for you, but I needed a challenge for the weekend. I'll spend most of tonight thinking of other information to put in there.

.


Good luck.

[INTRA-DAY ACTION]

Really frustrating day today. Market has just been cruising up all day, it does not care about resistance and it does not retrace. Even a momentum play is a no because of the speed at which this market can potentially reverse on you.

I have mostly been hedging my losses with adding and removing from my positions.

Update 19:20
DEESIDE PIPER HEADLINE: "Sensational short helps trader recover 80% to end the day nearly flat."

[INTRA-DAY ACTION]

Haven't done a technical post in quite a while. At the moment, given all these crazy rules, I am mostly just trading the S&P500. Todays recovery has been quite nice after such strong selling until about lunch.

Lots of technical indicators and patterns there, not even including any other indicators or moving averages except the 200ema. This is only the 1 minute chart, pretty sure this macro way is the second safest way to trade at the moment.

As you can see, this series of higher highs and higher lows has moved nicely after the SP dropped below price targets and formed a nice double bottom.

[INTRA-DAY ACTION]

Looks like short selling has been banned more or less worldwide in the financials today. I've got a couple of opinions on this;

Firstly, in the UK at least, it was only the institutions that could actually go short in the first place. Therefore any profit they made from shorting stayed in the markets. That's just what happens when one bank attacks another when they short.

Speculators have not been forcing down the stock price, it's all to do with the global economy being in a dire state due to all the bad debts. Debt equals less free money, therefore the cogs of the free market and economy can't work as well as they normally do when banks etc can loan and receive money from each other.

This will have a significant short term boost in the financial sectors across the world, as people with short positions will have to close them. A massive short squeeze will put severe buying pressure in the market and should lead to some strong gains. Most of the market jumped over 10% yesterday towards the end, and this should follow into today.

Also like to say that this Lloyds HBOS merger. Talk about a shotgun wedding - I think both are OK long term, and the risk to them will not decrease because they're merging. I am delighted with Lloyds who I use. They have bought HBOS for a song.

Anyway, today I will be focusing on trading the gap in the US financials this morning. I am looking at AIG, WM, WB, C as well as the US Banking Sector 
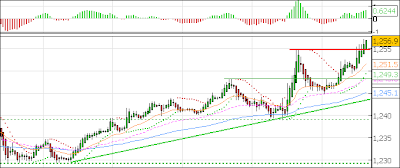
CFD and I will scalp out the S&P. The S&P is currently forming a double top leading into the market open in the short term, however this could really explode north by 50 points to 1300. It could also implode.. who knows in this market?

I have had one nice pre-market trade in the S&P which was an easy setup. Here's the chart to let you know what I'm checking out at 13:37.


Update 17:20
Down on the day after having a great few opening hours. S&P got really really choppy and started to reverse on me instantly. Pulled the plug on today because it's not a good idea to keep doing that. I have learned a few things again today;
  1. Do not increase your position size because you have been running hot with consecutive winners.
  2. Do not make 15 open and close trades in 3 hours - horrific overtrading.
  3. It is not a good idea to close and reverse to open a new position with double the size.
It was all going nice until I started to increase my size, expose myself to more risk and closing and reversing with increased size. All of that just meant that as soon as I lost, I was instantly trying to claw the loss back - which is definitely not a reason to enter a trade.

Also, CMC have suspended trading pretty much every financial stock that is listed anywhere. The thing that really gets me about this is the fact that they are a bookmakers whose primary service is to provide a client with a contract for the difference in the price of an instrument. The CFDs traded are a reflection of the price only, and the client does not buy or own any actual equity in a company thus not driving down the price.

It seems to me that CMC are only doing this because they must be losing an absolute fortune at the moment, and good riddance because they are a bunch of *******. On a side note, the prices for the S&P contract that CMC offer are constantly 3 points below the actual real-life value, which is very frustrating if you are working off different charts to gauge support and resistance.

Lots of news driving this market at the moment, I'm going to take a back seat until Monday and see what happens then. Hopefully I'll scam CMC out of some more coin.

Update 20:30
Goodbye free market. I tell you, I could not have picked a worse time to get into trading. It more or less seems now that the US government is blocking free trade. Who knows if anyone will actually be able to buy into a company anymore in 12 months time.

I've been following this guys blog recently, and he has hit the nail on the head with this post: You know what, it doesn't really matter anymore.

[INTRA-DAY ACTION]

Wow.

Today we could possibly reach some very significant areas in the S&P, FTSE and about every other major index. The S&P just touched on a 2 year double bottom at 1200, the same story goes on the FTSE too. If we fail these levels then there will be some serious action on the short side as the markets go into meltdown.

Oil is now also trading below $100.

I can't even think of a stock or sector that will benefit from all of this in the short term, so obviously my bias would be to short everything. The financials are going to gap down like nobodies business, and will probably sell off for the whole day. Meryl and AIG are the ones to watch, given that Lehman is officially bankrupt.. Unbelievable, that company is about 180 years old and it's just gone belly up within 4 years.

Charts galore is what I'll be posting later.

15:00 Update:
Big gaps down as expected as most stocks are hit hard. A few have already closed the gaps, Washington Mutual had a quick rally and has since tailed off after the gap price. I thought the techs might hold OK today, but a lot of them are down and flat on the gaps. The only sector really showing any strength today are the gold stocks, as most of them are up or even on the day.

Despite the weakness and volatility, the S&P 2 minute chart has proved excellent for simple technical setups in the short term with 6 or 7 nice measured moves ranging from 5-10 points since midday GMT.

[INTRA-DAY ACTION]

I'm really enjoying the markets at the moment, as there have been some really nice short term plays. I've been more of a technician this week than a trader, and I am learning that I function a lot better and more confidently when I'm not trading. I've been right the vast majority this week in the face of a volatile market, so I think my dream job would be a technical analyst at a firm.

Anyway, here's another great tool from finviz. Their heatmap is great, the 3D heatmap is better - but this is just excellent:


Just a really great app to check the whole market in 2 seconds. That strength is still showing in the metals after Tuesday - so which sector will bounce next? You can get that here

Also, the service from Today Trader is superb.

[INTRA-DAY ACTION]

Haven't posted in a while, not had a lot of time lately to be blogging. There has been some great trading setups in the past few days, particularly in RIMM and Nucor. This is just a post to say I'm still alive, but don't have much time at the moment.

This setup this morning in RIMM was a no brainer trade, but apologies for picture quality.


This hit 108 today after that move. Also Nucor, I called the bottom intra-day based on convergence and a double bottom just below 42 before it hit 46 too. There are plenty of opportunities out there, keep it simple and you will win.

[INTRA-DAY ACTION]

Today will be huge. The UK market has ceased trading due to "Technical Difficulties", after the market smashed through the roof and the financials opened up 12% on Fridays close. There are no technical difficulties here, all that has happened is that the City Boys have panicked, it is blatantly obvious they do not have a clue what to do without the US markets holding their hand.

This level of corruption is a disgrace. The system has been down for about 4 hours, which is totally unacceptable - can you imagine the news in America if the NYSE and NASDAQ just "stopped working" after a massive bull rally? It wouldn't happen. But we all know how dodgy the FTSE and City are - and if you are still prepared to trade the UK market after this, you are a complete idiot.

The Fannie Mae and Freddie Mac bail-outs will ease a lot of the credit crunch problems, but essentially shareholders will lose equity in these companies. However they will no doubt rally as people close shorts and fools take positions. I would be looking to trade smaller stocks who sell mortgages to these guys. The financials should rally hard today stateside, and most likely everything else.

However, after this rally, gaps will need to close and resistance will need to be re-tested as support, so I expect some very bearish action in the near future.

As for the UK.. well, the US market opens at 14:30 and the pre-market is underway. I would not be shocked to see those "Technical Difficulties" being fixed and all OK between 14:15 and 15:00.

Update 15:15
Pfff.. good luck trading this!

Update 16:00
Insane.. absolutely insane..

UAUA 1min chart, down 65% in 5 minutes, then up 100% within the next 4 minutes.

Rumour has it they are about to go bankrupt.

Also the UK market has opened, an hour later than I thought though.

[INTRA-DAY ACTION]

I was right about X at $120, at least in the short term. Nice jump this morning into a double top at $124 before a big drop off to lows of $116. Looks good for a short now.

Had a good day at college, and tomorrow I'm going round to a new friends house tomorrow to show him about the market and trading. Looking forward to that, because everything is more fun when you know other people are excited about it too. Couple of nice charts for swings on the 15min charts so should see some of those develop into good examples tomorrow.

I'm well impressed about GM today, and TSO showed good technicals to get back up to a key resistance point and then no more in the afternoon.

[INTRA-DAY ACTION]

Not much happening here, big jump and sebsequent drop in the S&P today. I also like X at $120 with a stop at $117..

[INTRA-DAY ACTION]

Today is a great example of what I mean when I say the UK market is a joke, and it only follows what the US does - albeit with a lot more manipulation. The US markets are closed today, so you can expect that the rich suits in the City do not have a clue what to do with the market, so they're just going to keep it stagnant and then wait to see what happens tomorrow. A bunch of chimps could handle a job in London - they don't actually do anything themselves.

Don't expect the UK markets to move until 12:30pm GMT tomorrow, when the US pre-market ripples make it over the Atlantic.

VOD volume today so far (1pm) - 25 million shares.
Average daily VOD volume last week - 125 million shares.
Average change in the ten most traded stocks today - 0.2%