[HOLIDAY]

Getting some sun over the Christmas break. Will be back trading (and blogging properly) again in early January.

Ho ho ho.

[INTRA-DAY ACTION]

Another huge sell off. After a million short signals 2 days ago, C has dropped to $5 and continues to look weak.

A few quality short signals have followed through today, most noticeably C but also TSO which topped at $11 with a channel high and today fell out of that channel hard:


Shorter term in TSO there was a nice double top at the 200ema after a gap down. High quality opportunity.

[STILL OPTIONS]

In the midst of recession mire lurks opportunity for the patient.

Take your pick from a variety of technical short indicators on C to coincide with the lay-offs:

Trade a straight forward channel on the TSO chart:


Continuation signals swiftly followed by strong reversal patterns on RIMM (DB, Inv. H&S):

Increase your petrol money by spotting the easy S break trades and tops in RIG:

Trade a magnitude of consecutive bear flags and 20ema retracements as your marvel at the low price in GM these days:


There has been some good action the past week or so, C has been nice even as I write this. I think the market is in a better shape than it was 3 weeks ago. The relentless bad news has finally been absorbed by the market as it realises it is in a recession and will be for a while. Good to get a clean out.

At this rate I expect to be back in the market around Christmas.

[STILL HERE]

I'm still on the go et al, too busy with a college project to watch stocks though. Eagerly anticipating the effect of the presidential results on the market in the next few days though.

If I were American, I would be voting Obama.

[INTRA-DAY ACTION]

FTSE bear flag just now, looking for support area around 3850 again. Descending triangle forming here on the 15min too - starting from about October 8th - check the 30min 4 weeker.

Actually here's the chart:

[INTRA-DAY ACTION]

Today has been another great day for simple technical analysis. Here is X, the ascending wedge has really followed through and I am surprised to see it at these levels, as my initial exit target was $37.50 - X is now at even fresher 52 week lows at £35.70.

I really like the brand image of X, shame I don't really need much steel. Steels and metals are really struggling now that China hasn't been on BBC News for about a month.. were the Olympics this year or what?


The best part of this chart, for me at least, is the re-test of the ascending wedge support line as resistance right at a double top and 200EMA press. That is the ultimate short signal in my opinion.

Market has sold again today with little relative strength in the stocks I'm watching. BAC has been pretty bad most of the day, and AKS looks very interesting right at this second. It's not selling off as much as X, but it has just dropped from it's 3 week ascending triangle formation and I am ideally looking for $12 as best entry.

Here's a peek at MON which I have been getting chartable with today too. I think it was Oscar of 'Live with Oscar' fame, who coined the phrase "If you see a double top - Sell a double top!". This is especially true in MON, which consistently sells a double top with gusto.

On a side note: I'm quite getting into the CMC charting package now, it's actually alright. But don't tell them I said that.

Update 20:41:
What a sell off we've had here. Markets getting absolutely creamed. FTSE is down like 200 points from close which will definately make the papers tomorrow.

X, MON, UAUA, VLO the big losers on the small list I've been watching. AKS fell out the trend line about an hour ago and has been slammed for about $1.50 already.

There is only one way to trade today - Short.

[INTRA-DAY ACTION]

Until today I haven't really spent much time watching charts during the trading day for a few weeks. Mainly because I haven't been trading but mostly because the pork chop was supermarket quality. Anyway I was watching charts to aid my bro whose account continues to defy 9.81m/s2.

Anyway I have started to do my TA off the 15minute charts. They are a lot less stressful and seem to respond better to analysis than 5 minute charts and even dailies in some cases (due to the volatility).

Anyway pulled a few trades out the bag today that were pretty easy. It would no be easy if there was money in them of course, but you wouldn't have had much draw down in these anyway. The BAC trade is a work in progress as it is showing some relative strength this afternoon.


Update 17:00:
  • Target 1 on BAC reached at $24.2, new target on trendline cira $23.6
  • X dropped off ascending wedge, looking to take out $42.5, $40 with bottom at $37.75
  • AKS failing 50ema, looking for $13 before trendline around $12
  • FTSE has hit channel trend for 5th time today
Market is selling folks.

Update post champions league game:
There was a decent rally for a while into the last half hour where some interesting things from a technical perspective happened.

First off AKS found a shorter term trendline not far below the 50EMA where it bounced again into the $15 resistance range to form a double top before closing just shy of $14. Interestingly there the 30min chart held the 50ema a lot better. I continue to be bullish on AKS in the medium term but be wary of a short term drop, as it will probably support at the ascending triangle trend line.

X had some nice movement after it dropped out of the bearish ascending wedge formation. After finding some support at thr mentioned $42.50 area, it ralled with the market and moved to the 200ema and prior wedge support line (now resistance of course), giving a great re-entry to short. X sold off $3 into close after that short signal.

Performance of the day goes to the FTSE 15 minute chart, which has held the same declining channel all day and continues to do so as we speak. It has been very clean all day and has given multiple short signals as explained in this chart:

In total with those trades a trader on their game could have traded for about 400 points up until right now. Even a slow trader being timid realistically could have slow-played for 200 points today on the FTSE with relatively low risk setups.

Also some analysis on BAC:

BAC hit target 1 today and was 10 cents off target 2. Looking at it now you can see a clear ascending triangle forming, as well as a potential ascending channel upon breakout of that formation. However BAC is hard work to trade therefore it would be wise to trade the retracement rather than the breakout.

[STYLE OVER SUBSTANCE]


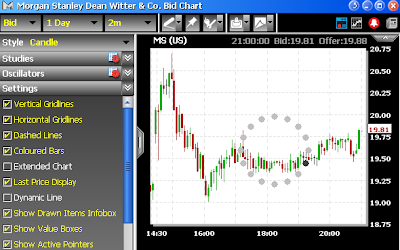
I keep wondering how the people at CMC are still in business when they continue to regress as a business. Take their new charts as another example of how to not entice business from regular traders. These charts are a total waste of time, absolutely useless.

They have done quite a few things that really irritate me as a trader and a chartist:
  1. They have re branded their charting to match the look of their spreadbetting adverts.
  2. They have eliminated third party charting, which is crucial when dealing with a bookmaker. That now means they can wobble the charts in whichever direction they desire.
  3. You cannot go back further than 4 days on a 5 minute chart!
  4. You cannot save your technical analysis on the charts.
  5. Despite a button to open up a ticket, you still cannot deal from the charts.
  6. The charts take way too long to load, it used to be 1 second it's now about 10
  7. You cannot create multiple candlestick panes on each window with different indicators.
  8. The charts are clearly based on some diabolical PDF display algorithm.
  9. WHO CARES WHAT THE CHARTS LOOK LIKE?
Anyway, I suppose it makes sense to CMC. The more novices they draw in through their spreadbetting platform, the more money they will make. Newer traders will see a sleek looking platform and think that, "Yus! I am a total city boy now, check me out!"

It's the move away from the third party (IT-Finance) that really bothers me though, especially given CMCs history of horrific execution and information at critical times during a trade. This now gives them free reign to manipulate all the data they want to. CMC are not a broker, they are a bookmaker - And bookies always win.

That's on top of them saying that their indices don't exactly mirror the real indices as they include what they call "fair value". Which basically means if you do a heap of TA and identify a key area around a big number and go in big, they will stop you out for a loss without your realising that in fact you did get it right, but their real values are off by 4-8 points.

One last thing, they got that guy.. what's his name. He was in Cold Feet and the Yellow Pages adverts. Jim something, he does their web adverts and narrates their training DVDs for the spreadbetting. How ridiculous is that? I mean, I've never met the guy, but I'm pretty sure he is not an elite trader. They're just using his Irish/You,know,what,he,is,almost,likeable,enough,to,be,my,friend,in,London to reel in cash rich punters with nothing else to do during their mid life crisis.

[INTRA-DAY ACTION]

Market rallied as anticipated.

However, anyone who thinks that a recession is over based on some weekend news is mistaken. There will be some good recoveries, but it will be a long time until the markets make a higher high re:long term chart.

'Normal' service is still not resumed, ie everything up 10%. I guess that has become the norm these days.

[INTRA-DAY ACTION]

Anyone who shorted the double top on the weekly chart of the all time S&P is a genius. I was looking at the chart last night, and never before has the market really failed to make a higher high, nor has it double topped so blatantly. It was the easiest move in the world to short the market and its constituents in October 2007. How many people actually did it and continue to hold their shorts though?

Probably whoever is still controlling the spiral.

Anyway, I've actually started to enjoy watching all these companies get annihilated lately. It's good to flush the crap out the system every now and again. When the market comes around, there will be a lot of money back in the system through investors and traders on all levels. When that happens (realistically a long time away) there will be some excellent trading.

Also like to give a shout out to my brother who pulled out some sensational trades on the FTSE and recovered from his 'Trader Death' last week.

Chart wise MON is still a buy if it gets to $70 again. It's holding up quite well today despite the selling however it continues the recent trend of lower highs. SUN was a good example of a gap recovery this morning, as it dropped below what I considered long term support around $23.4 before rallying to $26. It too has failed to retest the highs intra-day.

RIG is probably the most interesting on a technical level, as $65 represents some serious former resistance, and the price bounced nicely off this in the last hour.

The trendline on the 5min chart on X continues to hold from the highs on September 2nd. This is a highly tradable stock.

There are too many macroeconomics involved with these stocks at the moment though.

Update 18:50:
Check this out -

Slaughter.

AKS looks good for a quick trade at a double bottom at $10. Short term bottoms at these kinds of price levels seem to hold up ok, and I'd be looking for 20-30 cents. F was another short at $2 and is now at $1.89. You have got to wonder how a company like F is going to survive in this new global economy of ours.

Who is going to buy a new, poorly made, gas guzzling car on finance right now or within the next 12 months? Mind you we will probably see a mega rally up to $50, there is just as much chance of that I suppose.

TIE and X putting in very short term bottoms, as RIG is really struggling to hold that $65 level.

Update 19:50:
RIG double bottom at $65 for a market rally to close?