[HOLIDAY]

Getting some sun over the Christmas break. Will be back trading (and blogging properly) again in early January.

Ho ho ho.

[INTRA-DAY ACTION]

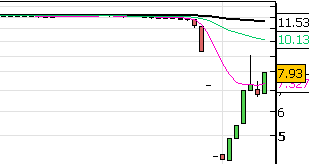
Another huge sell off. After a million short signals 2 days ago, C has dropped to $5 and continues to look weak.

A few quality short signals have followed through today, most noticeably C but also TSO which topped at $11 with a channel high and today fell out of that channel hard:


Shorter term in TSO there was a nice double top at the 200ema after a gap down. High quality opportunity.

[STILL OPTIONS]

In the midst of recession mire lurks opportunity for the patient.

Take your pick from a variety of technical short indicators on C to coincide with the lay-offs:

Trade a straight forward channel on the TSO chart:


Continuation signals swiftly followed by strong reversal patterns on RIMM (DB, Inv. H&S):

Increase your petrol money by spotting the easy S break trades and tops in RIG:

Trade a magnitude of consecutive bear flags and 20ema retracements as your marvel at the low price in GM these days:


There has been some good action the past week or so, C has been nice even as I write this. I think the market is in a better shape than it was 3 weeks ago. The relentless bad news has finally been absorbed by the market as it realises it is in a recession and will be for a while. Good to get a clean out.

At this rate I expect to be back in the market around Christmas.

[STILL HERE]

I'm still on the go et al, too busy with a college project to watch stocks though. Eagerly anticipating the effect of the presidential results on the market in the next few days though.

If I were American, I would be voting Obama.

[INTRA-DAY ACTION]

FTSE bear flag just now, looking for support area around 3850 again. Descending triangle forming here on the 15min too - starting from about October 8th - check the 30min 4 weeker.

Actually here's the chart:

[INTRA-DAY ACTION]

Today has been another great day for simple technical analysis. Here is X, the ascending wedge has really followed through and I am surprised to see it at these levels, as my initial exit target was $37.50 - X is now at even fresher 52 week lows at £35.70.

I really like the brand image of X, shame I don't really need much steel. Steels and metals are really struggling now that China hasn't been on BBC News for about a month.. were the Olympics this year or what?


The best part of this chart, for me at least, is the re-test of the ascending wedge support line as resistance right at a double top and 200EMA press. That is the ultimate short signal in my opinion.

Market has sold again today with little relative strength in the stocks I'm watching. BAC has been pretty bad most of the day, and AKS looks very interesting right at this second. It's not selling off as much as X, but it has just dropped from it's 3 week ascending triangle formation and I am ideally looking for $12 as best entry.

Here's a peek at MON which I have been getting chartable with today too. I think it was Oscar of 'Live with Oscar' fame, who coined the phrase "If you see a double top - Sell a double top!". This is especially true in MON, which consistently sells a double top with gusto.

On a side note: I'm quite getting into the CMC charting package now, it's actually alright. But don't tell them I said that.

Update 20:41:
What a sell off we've had here. Markets getting absolutely creamed. FTSE is down like 200 points from close which will definately make the papers tomorrow.

X, MON, UAUA, VLO the big losers on the small list I've been watching. AKS fell out the trend line about an hour ago and has been slammed for about $1.50 already.

There is only one way to trade today - Short.

[INTRA-DAY ACTION]

Until today I haven't really spent much time watching charts during the trading day for a few weeks. Mainly because I haven't been trading but mostly because the pork chop was supermarket quality. Anyway I was watching charts to aid my bro whose account continues to defy 9.81m/s2.

Anyway I have started to do my TA off the 15minute charts. They are a lot less stressful and seem to respond better to analysis than 5 minute charts and even dailies in some cases (due to the volatility).

Anyway pulled a few trades out the bag today that were pretty easy. It would no be easy if there was money in them of course, but you wouldn't have had much draw down in these anyway. The BAC trade is a work in progress as it is showing some relative strength this afternoon.


Update 17:00:
  • Target 1 on BAC reached at $24.2, new target on trendline cira $23.6
  • X dropped off ascending wedge, looking to take out $42.5, $40 with bottom at $37.75
  • AKS failing 50ema, looking for $13 before trendline around $12
  • FTSE has hit channel trend for 5th time today
Market is selling folks.

Update post champions league game:
There was a decent rally for a while into the last half hour where some interesting things from a technical perspective happened.

First off AKS found a shorter term trendline not far below the 50EMA where it bounced again into the $15 resistance range to form a double top before closing just shy of $14. Interestingly there the 30min chart held the 50ema a lot better. I continue to be bullish on AKS in the medium term but be wary of a short term drop, as it will probably support at the ascending triangle trend line.

X had some nice movement after it dropped out of the bearish ascending wedge formation. After finding some support at thr mentioned $42.50 area, it ralled with the market and moved to the 200ema and prior wedge support line (now resistance of course), giving a great re-entry to short. X sold off $3 into close after that short signal.

Performance of the day goes to the FTSE 15 minute chart, which has held the same declining channel all day and continues to do so as we speak. It has been very clean all day and has given multiple short signals as explained in this chart:

In total with those trades a trader on their game could have traded for about 400 points up until right now. Even a slow trader being timid realistically could have slow-played for 200 points today on the FTSE with relatively low risk setups.

Also some analysis on BAC:

BAC hit target 1 today and was 10 cents off target 2. Looking at it now you can see a clear ascending triangle forming, as well as a potential ascending channel upon breakout of that formation. However BAC is hard work to trade therefore it would be wise to trade the retracement rather than the breakout.
[STYLE OVER SUBSTANCE]


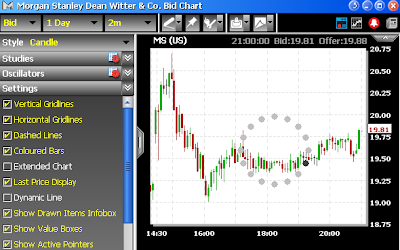
I keep wondering how the people at CMC are still in business when they continue to regress as a business. Take their new charts as another example of how to not entice business from regular traders. These charts are a total waste of time, absolutely useless.

They have done quite a few things that really irritate me as a trader and a chartist:
  1. They have re branded their charting to match the look of their spreadbetting adverts.
  2. They have eliminated third party charting, which is crucial when dealing with a bookmaker. That now means they can wobble the charts in whichever direction they desire.
  3. You cannot go back further than 4 days on a 5 minute chart!
  4. You cannot save your technical analysis on the charts.
  5. Despite a button to open up a ticket, you still cannot deal from the charts.
  6. The charts take way too long to load, it used to be 1 second it's now about 10
  7. You cannot create multiple candlestick panes on each window with different indicators.
  8. The charts are clearly based on some diabolical PDF display algorithm.
  9. WHO CARES WHAT THE CHARTS LOOK LIKE?
Anyway, I suppose it makes sense to CMC. The more novices they draw in through their spreadbetting platform, the more money they will make. Newer traders will see a sleek looking platform and think that, "Yus! I am a total city boy now, check me out!"

It's the move away from the third party (IT-Finance) that really bothers me though, especially given CMCs history of horrific execution and information at critical times during a trade. This now gives them free reign to manipulate all the data they want to. CMC are not a broker, they are a bookmaker - And bookies always win.

That's on top of them saying that their indices don't exactly mirror the real indices as they include what they call "fair value". Which basically means if you do a heap of TA and identify a key area around a big number and go in big, they will stop you out for a loss without your realising that in fact you did get it right, but their real values are off by 4-8 points.

One last thing, they got that guy.. what's his name. He was in Cold Feet and the Yellow Pages adverts. Jim something, he does their web adverts and narrates their training DVDs for the spreadbetting. How ridiculous is that? I mean, I've never met the guy, but I'm pretty sure he is not an elite trader. They're just using his Irish/You,know,what,he,is,almost,likeable,enough,to,be,my,friend,in,London to reel in cash rich punters with nothing else to do during their mid life crisis.

[INTRA-DAY ACTION]

Market rallied as anticipated.

However, anyone who thinks that a recession is over based on some weekend news is mistaken. There will be some good recoveries, but it will be a long time until the markets make a higher high re:long term chart.

'Normal' service is still not resumed, ie everything up 10%. I guess that has become the norm these days.

[INTRA-DAY ACTION]

Anyone who shorted the double top on the weekly chart of the all time S&P is a genius. I was looking at the chart last night, and never before has the market really failed to make a higher high, nor has it double topped so blatantly. It was the easiest move in the world to short the market and its constituents in October 2007. How many people actually did it and continue to hold their shorts though?

Probably whoever is still controlling the spiral.

Anyway, I've actually started to enjoy watching all these companies get annihilated lately. It's good to flush the crap out the system every now and again. When the market comes around, there will be a lot of money back in the system through investors and traders on all levels. When that happens (realistically a long time away) there will be some excellent trading.

Also like to give a shout out to my brother who pulled out some sensational trades on the FTSE and recovered from his 'Trader Death' last week.

Chart wise MON is still a buy if it gets to $70 again. It's holding up quite well today despite the selling however it continues the recent trend of lower highs. SUN was a good example of a gap recovery this morning, as it dropped below what I considered long term support around $23.4 before rallying to $26. It too has failed to retest the highs intra-day.

RIG is probably the most interesting on a technical level, as $65 represents some serious former resistance, and the price bounced nicely off this in the last hour.

The trendline on the 5min chart on X continues to hold from the highs on September 2nd. This is a highly tradable stock.

There are too many macroeconomics involved with these stocks at the moment though.

Update 18:50:
Check this out -

Slaughter.

AKS looks good for a quick trade at a double bottom at $10. Short term bottoms at these kinds of price levels seem to hold up ok, and I'd be looking for 20-30 cents. F was another short at $2 and is now at $1.89. You have got to wonder how a company like F is going to survive in this new global economy of ours.

Who is going to buy a new, poorly made, gas guzzling car on finance right now or within the next 12 months? Mind you we will probably see a mega rally up to $50, there is just as much chance of that I suppose.

TIE and X putting in very short term bottoms, as RIG is really struggling to hold that $65 level.

Update 19:50:
RIG double bottom at $65 for a market rally to close?

[CONTINUED SELLING]


It's relentless.

Here's the heatmap for the past few days, there is a significant difference the past 2 days where we have actually seen a scattering of green amongst some sectors. A few stocks are hovering at their most recent low levels, and despite a large amount of 52 week lows even today, there has to be some kind of bounce soon.

Rally on Monday anyone?

End of day update:
I've never seen capitulation selling so don't know what it looks like - but surely that was the start of it this afternoon with a follow through tomorrow for a rally tomorrow afternoon or Monday morning.

[INTRA-DAY ACTION]

More selling.

Only thing catching my eye today on a technical level is SUN which has strong historical resistance and therefore support at the $23.40 area. It moved slightly off this just now to $24. It's hard to anticipate a rally in SUN given the market, but a significant breach of this could provide a good short on a re-test.

In saying that, I was looking at AMD at $4.04 on Monday as long term support, and that held nicely an opened up at $5.4 on Tuesday before a strong pullback.

PS $46 for a share in X. Unreal. This was $146 not too long ago.

Update 17:55
Normally I would not laugh at the misfortune of other people, but today I had to. I used to love the DTRS chat room, but for the past few months it's just been swamped with idiots who are looking to piggy back his trades. He is a good trader, but the people he attracts are total morons. There are also a couple of regulars who think they rule the roost and preach their elite skills to everybody - but they talk just as much crap and several times a day you can watch their hypocrisy in action as they say one thing and then do the other.

Anyway, RS picked a bottom in F at $2.55. I mean, this is not a market to be calling a bottom in, that's how you lose money. Ford.. they make cars. Global warming, credit crunch, oil prices. $2.55 is a number that seems to be pulled out of thin air, the bottom after all is zero. It's not even a psychological level, nor a technical level.

Instantly, and I mean literally the second he said it, the chat room was flooded with people saying "in Ford at 2.56, 2.55, 2.57 - 2000 shares, $10k worth, 1000 shares". It was unreal - not a single "Are you sure? What's the setup? What's the target? What's the stop? Shouldn't I be shorting GM instead?". Basically all that was said was that if it moved 25 cents, you would make a 9% profit! WOW!

This really irked me for several reasons that are pretty much what I have learned to be the gospel of trading:
  1. Never even attempt to pick a bottom
  2. Never take a stock tip
  3. Plan every trade
  4. Never enter a trade without a target
  5. Never enter a trade without a stop
  6. Never enter a trade against the trend
  7. Do not be such a greedy pig
  8. Do not average down on a losing trade (3 or 4 did this later on)
  9. Do not use a blindfold when trading
Anyway, the chart at the time was ridiculous, literally just selling off in one huge down trend with good selling pressure. The stock went sideways at $2.55 for 4 minutes before the averages caught up with it.

When it did 4 minutes later, carnage, after everyone loaded the boat with F at $2.55, F was trading at $2.12 within 240 seconds. That is more or less a 17% loss within 4 minutes. Why on Earth would anyone put that level of risk on themselves if their pre-trade target (which didn't actually exist) was a 9% gain?

There was only one trader who said they took a big hit, and sold out as it passed $2.25. Everybody else held. Everyone held because they are idiots.

Ford bounced a bit back to the $2.4 region, and everyone continues to hold a loser. Even if F goes to $3 or $5, the only winner in my eyes is the guy who put his hand up and accepted he made a mistake, and took the punishment (a loss) in the testicles. Everyone else is simply a fool who really should not be trading.

If $2.55 was "the bottom", then surely if it is passed, it is now "the top".

Rant over!

[TRADE ACTION]

Any regular visitor here will realise that this is the first post for October, and that September had half the monthly average. I'm kind of sitting out waiting for normality to resume, however this selling just seems relentless.

Basically the market is selling, with a scattering of insane rallies based on absolutely nothing. That is not a safe nor profitable environment to be in having only been in the game for 6-8 months.

Hopefully the dust will settle by the new year, and some kind of slow rebuilding in the markets begins to level the playing field. I'll be back in the game when that happens. I'm a TA trader, and TA just isn't working effectively in this market. There is no point playing such a high risk game when there are no rules.

PS I am ultra chuffed with my comment a few months ago about the market getting worse in the future as it looks to re-test lows. Mind you, it was a complete no brainer comment!

Update 19:30:
Short term bottoms and tops are hopelessly easy to spot when you are not putting money on them. It must be a question of confidence:


These are a few I've flagged today and watch them move. The HD one happened as I drew the line, while the others have mainly been retracements from Mondays gap which I have been waiting for - an easy setup. There are still good moves in the individual stocks, but the reason people are losing, or not trading seems to be:
  1. The market could turn any second, if you have the wrong position, you are dead
  2. Eagerness to take profits quickly in this market will ruin you, conversely;
  3. Not taking them quick enough will ruin you, meaning;
  4. Your losses will outweigh your gains with this mindset
  5. Fear and Greed as always
  6. The more easy trades you miss, the more mistakes you will make
As I speak, RIG and TIE are moving off their respective trendlines and RIG is forming the basis of an ascending triangle. C is holding $16 as it challenges the level for the 4th time in 3 hours. HERO also dropped off as I wrote this, but has since bounced of the support line again. MON is a buy at $70 in my opinion too.

[TRADE TRACKING]

Developed it a bit over the weekend, here's some raw data from a certain somebody I know. It will probably take about 50 entries until the reports etc start to show some good information.

The stuff in blue is what I did today:

The ratio is the risk:reward calculation. The system also predicts what it thinks the outcome will be, this is based on:
  1. Max gain - Max Loss x R:R^2
  2. Average profits per trade
The heat index is just to rate the trade:
  1. 2 = Abysmal (bad risk reward, bad monetary reward)
  2. 3 = Below par (one bad, one good)
  3. 4 = Ideal (both risk reward and monetary reward add up)
The monetary reward is based on the predicted trade return being greater or lower than the average win/loss per trade. At the moment, after 4 losing trades, this data will always give a YES and a score for that column. After enough data is in there, it will be better to track each trade.

Couple of scalps in that selloff to add to the stats (heat index working now):

[TRADE TRACKING]

Spent most of the weekend programming a new spreadsheet for Excel. Always have to manually enter trades because my platform won't export the data. Anyway, pretty pleased with the outcome.

Couple of teething programs about the Excel code, I'm trying to code an IF AND THEN COUNT with minimal success. This part is for IF (setup) AND (profit) THEN (count). I would also like to try to eventually program in an odds calculator. For example if X and Y setups consistently reap profit on X, then increase reward ratios.

I am currently programming a risk:reward to profit ratio which should be interesting. Basically it involves a pre-trade calculator that will give you a number between 1 and 5. The numbers are based on historical data and represent high risk to low risk and high reward to low reward. If I can combine this data with average profits based on the particular setup, the calculator should then show if your odds are strongly favourable or are very weak.

I normally use risk reward as a simple ratio where target gains/target loss. The higher the number the better. This is good in itself, but I think combining it with other probabilities will give a good decision making calculation.

I also need to find a way to export trade data through VBA into Excel.

Anyway the entry screen (simple):

Outcome (with sample data):


Topical information:
  1. Calculates individual trade performance
  2. Calculates daily trade performance
  3. Calculates performance by setup
  4. Calculates profits by stock
  5. Calculates win loss ratios
  6. Calculates S/L bias and percentages
  7. Interprets whether you are currently beating hypothetical profits
  8. Calculates closed trades by Targets met, Targets exceeded or Failed to meet
  9. Interprets your ability to close out a trade with regards to entry targets
  10. Displays cumulative net profit
  11. Trade browser tree by Date/Profit/Share/Direction/Setup
  12. Trade cross-reference
Lots of these are based on simple formulas, eg to count a winning long
  • Long =1
  • Short = 7
  • Win = 1
  • Loss = 10
Therefore
  • 8 = Short win
  • 17 = Short loss
  • 2 = Long win
  • 11 = Long loss
Use the COUNTIF and SUM formulas.

I'm sure there are programs out there that do all of this for you, but I needed a challenge for the weekend. I'll spend most of tonight thinking of other information to put in there.

.


Good luck.

[INTRA-DAY ACTION]

Really frustrating day today. Market has just been cruising up all day, it does not care about resistance and it does not retrace. Even a momentum play is a no because of the speed at which this market can potentially reverse on you.

I have mostly been hedging my losses with adding and removing from my positions.

Update 19:20
DEESIDE PIPER HEADLINE: "Sensational short helps trader recover 80% to end the day nearly flat."

[INTRA-DAY ACTION]

Haven't done a technical post in quite a while. At the moment, given all these crazy rules, I am mostly just trading the S&P500. Todays recovery has been quite nice after such strong selling until about lunch.

Lots of technical indicators and patterns there, not even including any other indicators or moving averages except the 200ema. This is only the 1 minute chart, pretty sure this macro way is the second safest way to trade at the moment.

As you can see, this series of higher highs and higher lows has moved nicely after the SP dropped below price targets and formed a nice double bottom.

[INTRA-DAY ACTION]

Looks like short selling has been banned more or less worldwide in the financials today. I've got a couple of opinions on this;

Firstly, in the UK at least, it was only the institutions that could actually go short in the first place. Therefore any profit they made from shorting stayed in the markets. That's just what happens when one bank attacks another when they short.

Speculators have not been forcing down the stock price, it's all to do with the global economy being in a dire state due to all the bad debts. Debt equals less free money, therefore the cogs of the free market and economy can't work as well as they normally do when banks etc can loan and receive money from each other.

This will have a significant short term boost in the financial sectors across the world, as people with short positions will have to close them. A massive short squeeze will put severe buying pressure in the market and should lead to some strong gains. Most of the market jumped over 10% yesterday towards the end, and this should follow into today.

Also like to say that this Lloyds HBOS merger. Talk about a shotgun wedding - I think both are OK long term, and the risk to them will not decrease because they're merging. I am delighted with Lloyds who I use. They have bought HBOS for a song.

Anyway, today I will be focusing on trading the gap in the US financials this morning. I am looking at AIG, WM, WB, C as well as the US Banking Sector CFD and I will scalp out the S&P. The S&P is currently forming a double top leading into the market open in the short term, however this could really explode north by 50 points to 1300. It could also implode.. who knows in this market?

I have had one nice pre-market trade in the S&P which was an easy setup. Here's the chart to let you know what I'm checking out at 13:37.


Update 17:20
Down on the day after having a great few opening hours. S&P got really really choppy and started to reverse on me instantly. Pulled the plug on today because it's not a good idea to keep doing that. I have learned a few things again today;
  1. Do not increase your position size because you have been running hot with consecutive winners.
  2. Do not make 15 open and close trades in 3 hours - horrific overtrading.
  3. It is not a good idea to close and reverse to open a new position with double the size.
It was all going nice until I started to increase my size, expose myself to more risk and closing and reversing with increased size. All of that just meant that as soon as I lost, I was instantly trying to claw the loss back - which is definitely not a reason to enter a trade.

Also, CMC have suspended trading pretty much every financial stock that is listed anywhere. The thing that really gets me about this is the fact that they are a bookmakers whose primary service is to provide a client with a contract for the difference in the price of an instrument. The CFDs traded are a reflection of the price only, and the client does not buy or own any actual equity in a company thus not driving down the price.

It seems to me that CMC are only doing this because they must be losing an absolute fortune at the moment, and good riddance because they are a bunch of *******. On a side note, the prices for the S&P contract that CMC offer are constantly 3 points below the actual real-life value, which is very frustrating if you are working off different charts to gauge support and resistance.

Lots of news driving this market at the moment, I'm going to take a back seat until Monday and see what happens then. Hopefully I'll scam CMC out of some more coin.

Update 20:30
Goodbye free market. I tell you, I could not have picked a worse time to get into trading. It more or less seems now that the US government is blocking free trade. Who knows if anyone will actually be able to buy into a company anymore in 12 months time.

I've been following this guys blog recently, and he has hit the nail on the head with this post: You know what, it doesn't really matter anymore.

[INTRA-DAY ACTION]

Wow.

Today we could possibly reach some very significant areas in the S&P, FTSE and about every other major index. The S&P just touched on a 2 year double bottom at 1200, the same story goes on the FTSE too. If we fail these levels then there will be some serious action on the short side as the markets go into meltdown.

Oil is now also trading below $100.

I can't even think of a stock or sector that will benefit from all of this in the short term, so obviously my bias would be to short everything. The financials are going to gap down like nobodies business, and will probably sell off for the whole day. Meryl and AIG are the ones to watch, given that Lehman is officially bankrupt.. Unbelievable, that company is about 180 years old and it's just gone belly up within 4 years.

Charts galore is what I'll be posting later.

15:00 Update:
Big gaps down as expected as most stocks are hit hard. A few have already closed the gaps, Washington Mutual had a quick rally and has since tailed off after the gap price. I thought the techs might hold OK today, but a lot of them are down and flat on the gaps. The only sector really showing any strength today are the gold stocks, as most of them are up or even on the day.

Despite the weakness and volatility, the S&P 2 minute chart has proved excellent for simple technical setups in the short term with 6 or 7 nice measured moves ranging from 5-10 points since midday GMT.

[INTRA-DAY ACTION]

I'm really enjoying the markets at the moment, as there have been some really nice short term plays. I've been more of a technician this week than a trader, and I am learning that I function a lot better and more confidently when I'm not trading. I've been right the vast majority this week in the face of a volatile market, so I think my dream job would be a technical analyst at a firm.

Anyway, here's another great tool from finviz. Their heatmap is great, the 3D heatmap is better - but this is just excellent:


Just a really great app to check the whole market in 2 seconds. That strength is still showing in the metals after Tuesday - so which sector will bounce next? You can get that here

Also, the service from Today Trader is superb.

[INTRA-DAY ACTION]

Haven't posted in a while, not had a lot of time lately to be blogging. There has been some great trading setups in the past few days, particularly in RIMM and Nucor. This is just a post to say I'm still alive, but don't have much time at the moment.

This setup this morning in RIMM was a no brainer trade, but apologies for picture quality.


This hit 108 today after that move. Also Nucor, I called the bottom intra-day based on convergence and a double bottom just below 42 before it hit 46 too. There are plenty of opportunities out there, keep it simple and you will win.

[INTRA-DAY ACTION]

Today will be huge. The UK market has ceased trading due to "Technical Difficulties", after the market smashed through the roof and the financials opened up 12% on Fridays close. There are no technical difficulties here, all that has happened is that the City Boys have panicked, it is blatantly obvious they do not have a clue what to do without the US markets holding their hand.

This level of corruption is a disgrace. The system has been down for about 4 hours, which is totally unacceptable - can you imagine the news in America if the NYSE and NASDAQ just "stopped working" after a massive bull rally? It wouldn't happen. But we all know how dodgy the FTSE and City are - and if you are still prepared to trade the UK market after this, you are a complete idiot.

The Fannie Mae and Freddie Mac bail-outs will ease a lot of the credit crunch problems, but essentially shareholders will lose equity in these companies. However they will no doubt rally as people close shorts and fools take positions. I would be looking to trade smaller stocks who sell mortgages to these guys. The financials should rally hard today stateside, and most likely everything else.

However, after this rally, gaps will need to close and resistance will need to be re-tested as support, so I expect some very bearish action in the near future.

As for the UK.. well, the US market opens at 14:30 and the pre-market is underway. I would not be shocked to see those "Technical Difficulties" being fixed and all OK between 14:15 and 15:00.

Update 15:15
Pfff.. good luck trading this!

Update 16:00
Insane.. absolutely insane..

UAUA 1min chart, down 65% in 5 minutes, then up 100% within the next 4 minutes.

Rumour has it they are about to go bankrupt.

Also the UK market has opened, an hour later than I thought though.

[INTRA-DAY ACTION]

I was right about X at $120, at least in the short term. Nice jump this morning into a double top at $124 before a big drop off to lows of $116. Looks good for a short now.

Had a good day at college, and tomorrow I'm going round to a new friends house tomorrow to show him about the market and trading. Looking forward to that, because everything is more fun when you know other people are excited about it too. Couple of nice charts for swings on the 15min charts so should see some of those develop into good examples tomorrow.

I'm well impressed about GM today, and TSO showed good technicals to get back up to a key resistance point and then no more in the afternoon.

[INTRA-DAY ACTION]

Not much happening here, big jump and sebsequent drop in the S&P today. I also like X at $120 with a stop at $117..

[INTRA-DAY ACTION]

Today is a great example of what I mean when I say the UK market is a joke, and it only follows what the US does - albeit with a lot more manipulation. The US markets are closed today, so you can expect that the rich suits in the City do not have a clue what to do with the market, so they're just going to keep it stagnant and then wait to see what happens tomorrow. A bunch of chimps could handle a job in London - they don't actually do anything themselves.

Don't expect the UK markets to move until 12:30pm GMT tomorrow, when the US pre-market ripples make it over the Atlantic.

VOD volume today so far (1pm) - 25 million shares.
Average daily VOD volume last week - 125 million shares.
Average change in the ten most traded stocks today - 0.2%

[CRYSTAL BALLING - SEP 1st -5TH]

A little bored this week, so just been scanning some UK charts - something I don't do much these days.

Last week I was talking about LSE, WMH and WSH. WSH jumped out nicely on Friday with 4% gains. LSE did more or less the same thing, and WMH is just consolidating. These aren't big stocks, and I would be hesitant to trade them - but I'm trying to convince myself that there are still profit opportunities in the FTSE.

Anyway, keep an eye on these this week. I haven't done a CB in yonks, but oh well!

LAND (Land Secs)

I'm negative about this stock, don't like the divergence as it reaches a prior support and new resistance for the third time. The 3rd attempt scenario is the only thing really going for it here I think. 1390 is the key value here, and a rejection of this could easily being back 1150.

Long on a break of 1400 though, and anticipate the retest. The 200EMA is not on this chart, and is currently at 1445, so perhaps take profits at this price if it breaks.

YELL (Yell Group)

I like YELL, but only as far as 135 before it re-tests the bottom, or 110 if it clears that first. I like the MA cross and the distance from the 200 (the blue line is the 100). Realistically, the only position I'm looking at with YELL is shorting it as it backs away from 135.


WOLS (Wolseley - not sure if the EPIC is right)

Doesn't get much easier than this. Cup and handle break last week on this one, and I'm looking firstly for a 100EMA break, and then a surge past horizontal resistance at the nice round number of 500 for entry with a tight stop circa 495.


Really need the trendline, 100EMA and resistance break on this one before entry, and I figure they will all come on one rally day this week. If it fails 500, then expect a quite fast pullback. 300 is too obvious there, maybe 400 or 450. This is ripe for both a long and a short really, and the added bonus of the 500 mark will be fuel to our position fire. Tight stops and nice profits please, medium target 575, longer target 650.

The other stock I am tracking is Logica (LOG?), which has broken 130. I expect this to re-test 150 - but beware the retrace to 130 somewhere in the mix. It is nicely above all the moving averages, and a pullback would be an excellent opportunity given the short distance between the 200EMA and the 130 support. I'll shove the chart up a bit later, I've got stuff to do.

I am also watching WMH, LSE and WSH this week too, but very passively.

[INTRA-DAY ACTION]

Check out the CME trade, I mentioned a short at $343 with a target at the breakout price of $335. Perfection trade.


Just got back and had a quick scan. AAPL got shot today, GM dumped off yesterdays highs (and double top) at $10.50 and is current $10.05. This level continues to hold up in spite of the markets volatility.

[INTRA-DAY ACTION]

Having a horror week here. Every position I've had this week has given me a loss, but every position I've been in has ended up going my direction.

My system is so risk averse that it is costing me money.

Charts later. TSO is to the US as RBS is to the UK.

Good GDP numbers today in the US. All of this oil crap about this hurricane is total rubbish, it is just a little storm, and the media is sensationalising it to get the speculators to push the price up so the fat cats at opec make some more money.

Can you tell I'm on tilt again this afternoon?

Update 15:56

Lost on CME, tight stop and bad entry. This area now at $343 looks like the better area, given the divergence on the MACD. I won't trade because I'm on tilt there, but watch this space for an update on CME later.

Update 16:00

Just gotta post this CME chart, it looks absolutely ripe for a short right now. I'm looking for $335.


Midnight update:

I was well off the mark with CME, it only dropped to $338 after, and closed the day at a double top circa $344 after a strong rally into close. But I'm totally cool about that, because I wasn't in it.

Also, the new Batman film is really good. See it if you haven't already.

[INTRA-DAY ACTION]

Learn a lesson from every trade:


I knew I was right about TSO, but my entry was horrible. I even said it was a value entry at $16.40 on yesterdays post, but didn't enter because I was on tilt. Holding my original position would have put me on over $350 at the moment.

Lessons:
  • Stick to your gut shot
  • Loosen the stops (I have to learn to do this)
  • The trade is all about the entry in this market
Really struggling again today with my timing in getting back from college. 15:30 is just too late to catch the good entries. I'm also shifting my focus into sectors and indices as they allow for better risk management and lower commissions.

Not much happening yet, oil is smashing it's clout around. UAUA is dumping, and GM is still holding $10.

I just realised that TSO popped to new highs and is now at $18.35 which would be profit over $450. A lesson learned indeed!

From my swing list this week, AMD is getting close to entry. Nice move in LSE today, waiting for confirmation tomorrow. NVDA struggling to hold and showing some weakness, while the other techs SDK and TXN look Ok. Other UK stocks showing irrelevant movement.

Market looking OK today, shame about some missed trades, the 14:50 to 15:10 window provides the premiums.

[INTRA-DAY ACTION]

Bad TSO trade:

Missed the double top because I was just getting back from college. Blatant sell signal seeing how it was also a touch on the downward trendline. I went long looking for a supportive 200MA (not on chart), but it failed and I bailed out. Good exit because it crashed again. Really should not have entered on the 200MA given the lack of a definitive short term trend.

The ideal technical entry based on this chart, is $16.40 or $16.25 depending on which double bottom you use with stops at $16.325 or $16.20.

Seems I got back at a really bad time as I missed a good support touch and subsequent $4 pop in X.

GM still holding on to the $10 range which is now a value entry price given the workable supportive range from $9.9 to $10.05.

By the time I get back from college on Tue/Wed/Fri I will have missed the most important time for trading (3pm-3:30pm my time) the nice setups. I will just have to be a lot more patient.

Not much else happening, my swing trades from Sunday are still shaping up OK - with none thus far giving a signal either way yet.

[INTRA-DAY ACTION]

Market getting mauled today. Not a single sector even close to being even flat on the day. Lost on 2 positions this morning, small losses in F and TSO. Both were relatively good setups that just ticked at my stop so got out. TSO has dropped another 40 cents from exit so that was nice. I had a very hard stop on F but it just looks way too bearish to be holding just now.

Elsewhere I'm sizing up GM if it drops a little more to $9.92. Also tried to short 350 UAUA at $13.1 but broker said "the share was suspended" so couldn't and it hit $12.2 within the hour. TSO is at a support zone at the moment, but I get burned whenever I enter TSO so I think I will pass that trade up.

CMC complaint part 100:

That's only on 4 S&P contracts, and is only pennies. But that's another lie from CMC. They should really say they are "Nearly commission free, but not quite".

[ALL RIGHTS REVERSED]

I'm about 3% into scanning the daily charts in the US and UK markets as I shift my focus back to longer term charts in lieu of the new year at college starting next week. It is unbelievabley bearish everywhere. I'm not finding anything worth trading on either side yet, but there are a few interesting little patterns and prices shaping up in a few of the stocks I cover intra-day.

Potential swings in the next 2 weeks so far;
  • TSO looks like it is going to re-test the lows of the $14.80 area as it is stuck in a very strong downward trend.
  • AAPL on a breakout of $180 will be very interesting given recent resistance
  • NVDA gap fill recovery after a retracement?
  • PAYX showing early signs of descending triangle formation?
  • RFMD nice gap support resistance channel
  • SNDK beaten down for support at $13.10?
  • JNJ to retrace to breakout price at $69?
  • Double bottom on TXN around $24
And 3 UK stocks:
  • WSH actually looking good for a bounce off 450
  • LSE approaching double bottom
  • Same setup as LSE on WMH
I'm gonna check these out in more detail just now across a few time frames and I will post anything interesting here later. This could end up as a Crystal Balling thread.#

Monday morning update:
Will post some charts later. I've been thinking about going back to swing trading a lot lately, and for some reason I'm not really looking that forward to it. It will be less stress, but after trading intra-day so much the transition could be difficult! I love 5 min charts so switching to dailies or 60min will be like watching paint dry.

[INTRA-DAY ACTION]

Didn't get behind the desk till after 4pm today. Big $20+ pop in CME this morning, looking good as a medium term hold once it breaks the daily pattern.

GM looking good at support at $9.90, and I'm short TSO at $16.32. Little risk in this short, seems to have fallen off support, and despite the market being up TSO is down at new lows for the day.

Will be spending a lot of time this weekend going over some longer time scale charts. I start back at college next week, and I get Monday and Thursday off for day trading. I will probably trade larger positions through swing setups, as time management will be vital for me this year.

The hourly charts are what I'm going to be looking at. I will still be only trading US stocks and sectors - the only stock I am even considering for the UK is Rio Tinto on size and risk ratios.

Not sure how many charts will be worth posting today, potentially GM but not likely.

19:30 update:
You will not see an easier set up than this. Perfect bounce right up to the profit target without looking back on GM.

I am not waiting for signs of this topping here, as this is actually a triple top not just a double.

[INTRA-DAY ACTION]

Oil soaring pre-open today, Fannie and Freddie in another meltdown. Expecting a big dump in financials and a lot of money moving into materials and oil today. I'm watching RIG, SLB, X and OXY on these plays long. Also watching Nucor and Alcoa.

A nice ascending triangle on MA 5min chart is coming to a head, and support resistance levels on drops over at RIMM, BIDU, GM and TSO could be worth playing later in the day. TSO and GM should really be selling off today if oils momentum continues - however I still view $9.96 as strong support on GM so a break of that could see a sizeable drop.

Today should be a good day to make money, but the market will be moving pretty fast and it will be important to watch oil. I will continue to practice the ultra risk:reward mantra today as it has been successful since I've started to adopt that entry strategy.

15:15 update:
FRE on absolute fire this morning, up 35% from the lows of the day after gapping down 8%. That's an easy $1000 if you had enough plums to get into that this morning. I definately did not!


Gap up in the oil stocks have retraced and are attempting to push higher. Alcoa showing nice strength but still a little too close to the downward trendline.

Not much else showing up this morning yet.

15:30 update:
Really need to start programming an effective alert system. Twice in two days I've missed good moves off prior sup/res areas on UAUA. These types of entries offer very low risk.


19:00 update:
Wow - what a boring day. No real action as most stocks just grind along forming ridiculously elongated patterns (RIG 5 min, pennant all day). Calling it a day, this week has been bad for excitement.

[INTRA-DAY ACTION]

Going to miss the start of the day due to a hospital appointment, and because of that it could be a very interesting day. I'm holding GM into open tomorrow, which is bad enough in itself. However it's made worse by the fact that CMC markets don't allow you to create stop or limit orders when the market is closed - can you believe that? Of course you can.. they're crooks.

My mental stop at $9.9125 has now become a non-existant stop, which even when I can place the order, can only be as tight as $9.82. These are two easy methods that bookies use against you - they say you should not have your stop closer than a few percent away - but that completely eliminates the risk management gospel that they preach in their seminars. Absurd!

Anyway, apart from my GM woes my hitlist is the same as yesterday. I've also found a neat little tool from the NYSE website called MarkeTrac which although delayed, looks quite good.

I won't be back from town probably until 5pm GMT so hopefully the market has stabilised and is showing a few clean entries. Fingers crossed that GM rockets up 4158% too.

15:45 update:
OK GM is moving up so that's all good. My TSO trade from yesterday would have been a nice winner, but I missed the signals there while away. X and RIG showed some strength at open but have tailed off. I'm not seeing much else on the board, waiting mostly to see if GM will get passed $10.11 cleanly with a golden cross and some nice other indicators. Seems to be stalling somewhat at this range today.

15:55 update:
I did not expect this from GM;

I took an early exit from the trade for a confidence boosting profit. I didn't expect that rally at all, and although I believe GM will climb higher, I've got to have a celebration today to get over last week.

17:25 update:
Excellent exit in GM - it's dropped back below my entry price. I'm putting up a chart of GM at the moment because it's interesting. We have a battle between support and indicators. I think every indicator on there says sell, but GM is at the $9.95 support area which has proved to be very strong for the past few days.


Not on the picture but there was just a nice hammer after the selling so that's 1-0 to longs against shorts in this war.

[INTRA-DAY ACTION]

Another tricky day ahead of us here. Lots of selling and some bearish patterns forming in the indices, we will see what happens when this intra-day consolidation is broken. There are a couple of stocks approaching support, but on a day like today this might not hold.

Today I'm watching: GM, CME, BAC, RIMM, TSO and RIG.

BAC has slumped off support and the financials are dragging the rest down. I'm looking for relative strength but I'm not really finding anything.

UAUA from yesterday consolidated out of the flag and has hit $15.50, quite a bit off the target and is currently forming a double top on the 5min. Elsewhere there aren't really and potential trades. Check back later for updates and charts.

16:30 update
Really quiet day today, lots of selling and oil is holding a lot of stocks down. Oil stocks are looking pretty good. I'm really watching GM closely at the moment as it looks like it is showing early signs of a bottom at $10.05. As yet there are no other signals in that besides the consolidation.

CME had an aggresive $5 rally before striking the 100EMA and reclining - however the fastlines have crossed and I'm waiting to see if it holds at $339.

UAUA is about the only representation of decent TA I've seen today;

Nice bounce off previous resistance and moving average for a better than expected rally. Textbook measured move on the failure of support too as it forms a tilting head and shoulders formation.

18:30 update:
I lost a tiny amount on a TSO trade just now, really didn't mind losing that one as the risk reward was essentially 1:20. Only thing annoying about that trade was the amount of time it took my CFD broker to close out, my stop was .69 and my "fill" was .66. CMC markets are a joke when you're trying to close out a trade - they want to extract the maximum amount possible from you, so in a moving market they will just hold back your order. Anyway..

I'm currently waiting for a similar setup to pan out in GM. I took both positions on support and a double bottom. Oil is rising this afternoon so I fear it will be 2-0 for the losses today and 3-0 for the week. Seem to be struggling for follow throughs this week. My trades in GM and TSO are both longs under the MAs so that explains the losses, but with favourable R:R I can deal with the defeats.

Here's the entry/exit on TSO, at the moment at $16.50 so a nice exit


The ratio is effectively 1:30 then in that case, and not 1:20 as I mentioned earlier. If you manage to trade these setups and stick to your targets and stops, in the long run you will be a successful trader.

As I talk GM is trying to break the 50EMA for the second time. I'm riding this one out with a stop at $9.9125 after entry at $10.01 with an initial target around $10.50.

I'm also watching with interest the recovery in the financials post lunchtime. Nice rounding bottom in BAC which I'm looking to get to the opening price before the closing bell.


20:00 update:
GM still stalling around the $10, and it's now a case of evaluating the trade going in to the close as I'm not convinced I should be holding this kind of stock overnight at the moment.

TSO is currently staging a mini-rally, however nothing else oil related is showing up on my other charts so I wonder what's causing the ramp. I am not convinced it will hold given the lack of other rallies in stocks like GM, UAUA, RIG and OXY at the moment.

Elsewhere BAC found resistance at the previous support (green line) and has sold off $0.40. I'm now waiting for a retest of the resistance or a double bottom at around $27.85.

I keep checking back over at UAUA every hour and it is continuing to impress me with the concentration of technical analysis indications in such a short space of time.